
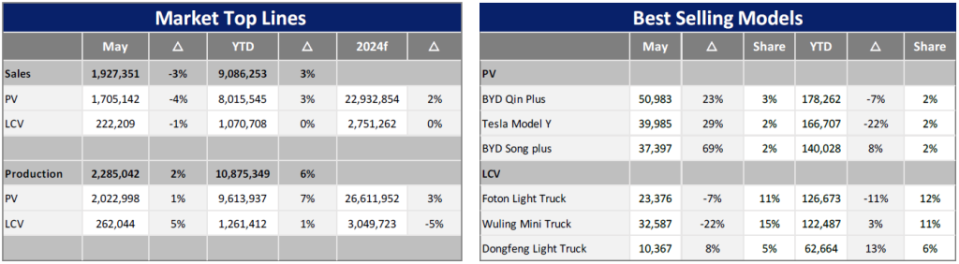
In May, China’s light vehicle (LV) market showed steady growth and continued structural optimization, reflecting a positive recovery trend. LV’s domestic sales, excluding exports, came in at 1.9 million units, down 3.2% year-on-year (YoY), but up a commendable 5.0% month-on-month (MoM).
Within the segment, passenger vehicle (PV) sales, impacted by the high base of the same period last year, fell 3.5% year-on-year but still accounted for 1.7 million units. Meanwhile, sales of Light Commercial Vehicles (LCV) reached 222,000 units, with a slight annual decrease of 0.6%. Cumulatively for the first five months of this year, LV sales reached 9.1 million units, an increase of 3.0% year-on-year. Within this, PV sales contributed significantly to growth, reaching a total volume of 8.0 million units, an increase of 3.4% per year. In contrast, LCV sales remain a significant share of the market, albeit slightly down 0.1% year-on-year to 1.1 million units. The implementation of the money subsidy details of the “old for new” policy, the stimulation of consumer enthusiasm by the Beijing Auto Show and the temporary cooling of the new product price war in the car market have slightly eased the sentiment of waiting and watching the market. Consequently, MoM, PV sales increased by 6.5% compared to last month. However, the recovery of the LCV sector seems to take more time, as it still experienced a 4.8% decline in May.
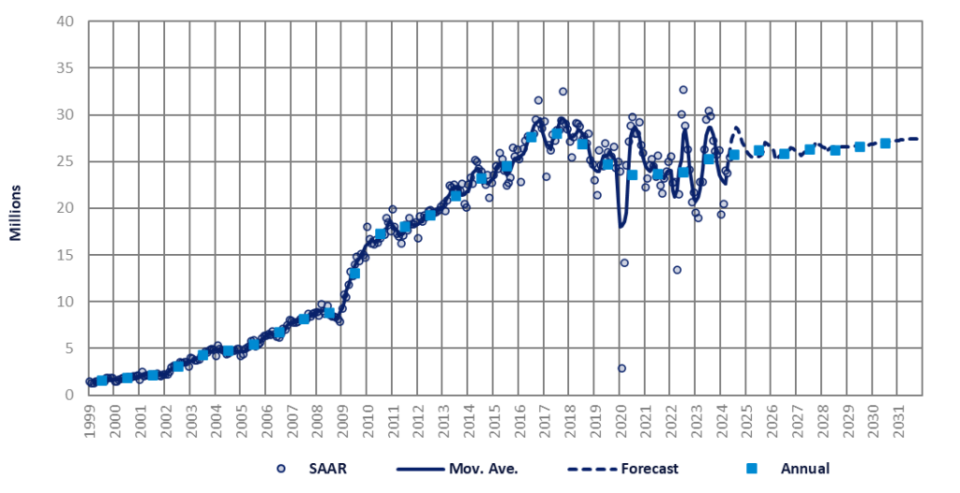
The May sales rate stood at an annualized 25.4 million units/year, reflecting a strong 7% increase from last April. Despite this growth, the average year-to-date (YTD) sales rate remains moderate at 22.6 million units/year. In annual comparisons, May sales, at the wholesale volume level, suffered a slight decrease of 3.3%. However, when the cumulative total for the year is considered, there was a modest overall increase of 3%.
On the manufacturing front, LV production for the month of May was recorded at 2.3 million units. This represents a modest annual increase of 1.6%, despite a small mom decline of 1.0%. When considering the cumulative production for the year to date, the volume reached an impressive 10.9 million units, showing a commendable growth of 6.5%. Breaking down the numbers further, PV production, which accounts for 90% of total TU production, remained steady in May at 2.0 million units, virtually unchanged from the previous month, with an annual increase of 1.2%. Production figures for Chinese OEMs showed a significant 16.6% annual increase, in contrast to a significant 18.9% annual decline in production for joint venture (JV) brands. Conversely, the LCV segment reported a more dynamic performance, with volumes for May reaching 262,000 units, reflecting a healthy 5.1% year-on-year growth.
The story continues
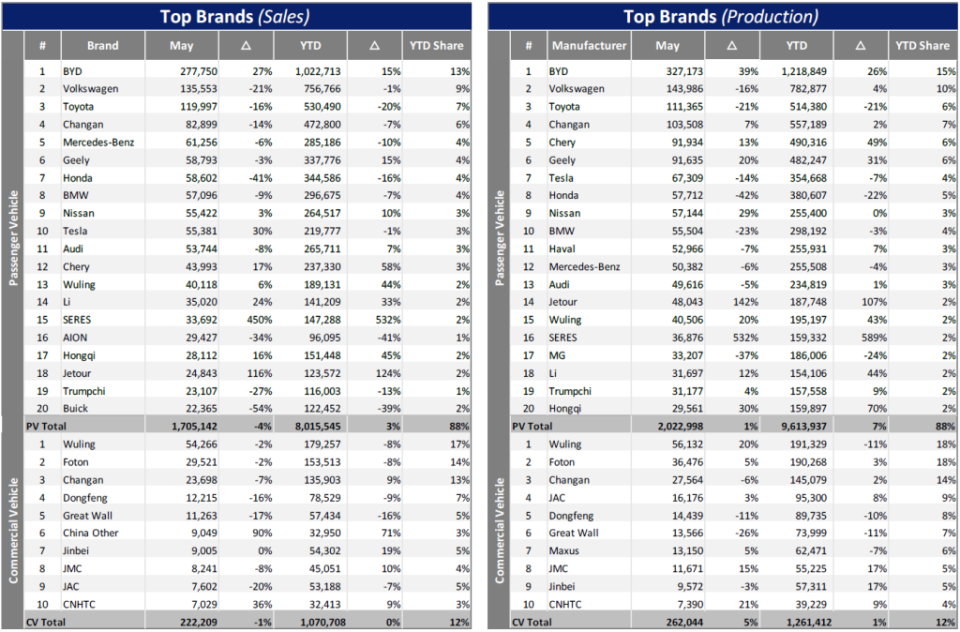
In May this year, export momentum in the Chinese auto industry showed a slight slowdown, but it remained strong, with shipments reaching 390,000 units. This represents a significant annual growth of 26%, with exports accounting for 19% of total PV output, underlining their contribution to overall output growth. The ranking of OEMs by export volume continues to be led by Chery, SAIC and Geely, which together account for 46% of total export volume. Despite recent disruptions from external factors, notably the EU’s announcement of increased tariffs on Chinese electric vehicles, export figures may experience short-term volatility. However, the long-term outlook for the new energy export market remains optimistic and promising. On a counterbalancing note, these challenges are also expected to accelerate the expansion of Chinese auto companies setting up overseas manufacturing facilities, potentially mitigating the impact of tariffs and strengthening their global presence.
In May, China’s NEV production rose to 886,000 units, a significant 30% year-on-year increase and a modest 9% mom increase. This impressive output has taken the NEV market penetration rate to 42.6%, highlighting a significant change in market dynamics and a strategic realignment by domestic manufacturers. The battery electric vehicle (BEV) segment contributed 461,000 units to total NEV production, with a more moderate annual growth of 10.6%. Despite this steady growth, mom’s growth was significantly higher at 19.1%. However, the BEV share of NEV sales has fallen below 60%, deviating from the initial forecast of a 65% share for an extended period. This change can be attributed to the development of hybrid technology, especially in the interim period before the widespread adoption of solid-state batteries. The Plug-in Hybrid Electric Vehicle (PHEV) segment has excelled, with an annual growth of 76.1%, producing 273 thousand units. The PHEV segment also demonstrated strong MoM growth of 7.9%. This high sustained growth rate reflects a growing consumer preference for PHEVs, which offer the combined benefits of electric propulsion and traditional ICEs, catering to a diverse range of driving needs and preferences.
In this month’s revision of our short-term forecast, despite May sales meeting our expectations, we have decided to raise our 2024 PV sales forecast by 208,000 units. This upward revision is driven by recent government policy announcements, which are expected to significantly boost sales in the second half of 2024. The forecast for LCVs remains largely stable, with only a slight adjustment in 2024. As a result, our 2024 LV sales are up 1.8% (higher than the initial estimate of 1%), targeting a total of 25.7 million units. It should be noted that this adjustment of the forecast belongs only to the year 2024; the forecast for 2025 and beyond remains unaffected by this update.
This article was first published on GlobalData’s dedicated research platform, the Automotive Intelligence Center. For more details on the Light Vehicle Sales Forecast module defined by GlobalData, click here
“In data: China market shows positive recovery trend” was created and originally published by Just Auto, a brand owned by GlobalData.
The information on this page is included in good faith for general informational purposes only. It is not intended to be advice on which you should rely, and we make no representations, warranties or guarantees, either express or implied, as to its accuracy or completeness. You should obtain professional or specialist advice before taking or refraining from any action based on the content on our site.
Image Source : finance.yahoo.com, https://www.pexels.com/