On Friday, the cryptocurrency market faced significant losses, with Bitcoin falling below the key support level of $55,000, leading to broad declines across the sector.
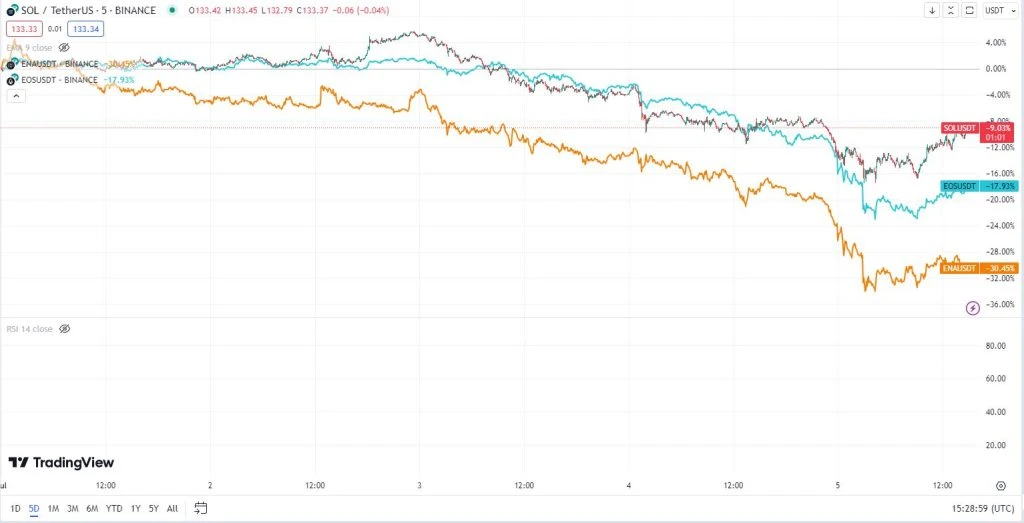
Altcoins such as Solana (SOL), Athena (ENA) and EOS suffered a sharp decline, each dropping over 10% within 24 hours. Consequently, the total market capitalization of all currencies fell from a year-to-date peak of $2.7 trillion to $2 trillion.
The fall in crypto prices was further exacerbated by the release of strong non-farm payrolls (NFP) data from the US. The Bureau of Labor Statistics reported that the economy added 206,000 jobs in June, beating the 191,000 forecast. The figure also beat Wednesday’s ADP report, which showed the private sector added 150,000 jobs in July.
Additionally, the report highlighted steady wage growth in June, with average hourly earnings rising 3.9% year over year. However, not all indicators were positive; The unemployment rate rose slightly from 4.0% in May to 4.1% in June. Despite this small increase in unemployment, the labor market shows strong health, adding over 1.57 million jobs this year.
The Federal Reserve’s stance on interest rates amid sustained inflation
The latest jobs numbers show that the Federal Reserve is unlikely to rush to cut interest rates as inflation remains relatively stable. The latest data revealed a slight slowdown in the Consumer Price Index (CPI) to 3.3% in May, while the Personal Consumption Expenditure (PCE) index held steady at 2.5%.
Fed Chairman Jerome Powell, in a recent statement, expressed the need for more evidence of falling inflation. Additionally, minutes from the Fed’s last meeting suggest a possible rate cut later this year, possibly in December.
Given this backdrop, the Federal Reserve’s firm stance is expected to put additional pressure on risk assets, including cryptocurrencies such as Athena, Solana, EOS and Bitcoin. This development coincides with the various challenges these digital currencies face. For example, Bitcoin has fallen below the critical support level in its dual pattern, signaling possible further declines.
Adding to market uncertainties, Germany has begun liquidating its Bitcoin holdings, resulting in increased balances on cryptocurrency exchanges. Additionally, wallets associated with the infamous Mt.Gox incident have been active, moving their coins around, which may affect market dynamics.
Political factors in the US may also play a role in the trajectory of the cryptocurrency market. Speculation is growing that President Joe Biden may not seek re-election, potentially paving the way for a younger candidate who may have a better chance against Donald Trump in the upcoming election. Trump is generally seen as more favorable to the cryptocurrency sector.
In light of these technical and fundamental challenges, the short-term outlook for cryptocurrencies remains subdued, with the potential for further declines in their values.
How is Solana performing? Solana (SOL) price analysis.
The 9-day Exponential Moving Average (EMA), which is shown as a blue line and is currently positioned around $141.27, is crucial for assessing Solana’s short-term trend. With Solana’s price hovering below this EMA, there is an indication of a possible bearish sentiment in the market, making the EMA an important resistance barrier that challenges upward moves.
In terms of momentum, the Relative Strength Index (RSI), shown in light purple, has risen to around 60.11 after rallying from the lows. This entry into the ’60’ territory signals increased buying momentum, although it remains below the overbought mark of 70, which usually suggests the possibility of a market pullback.
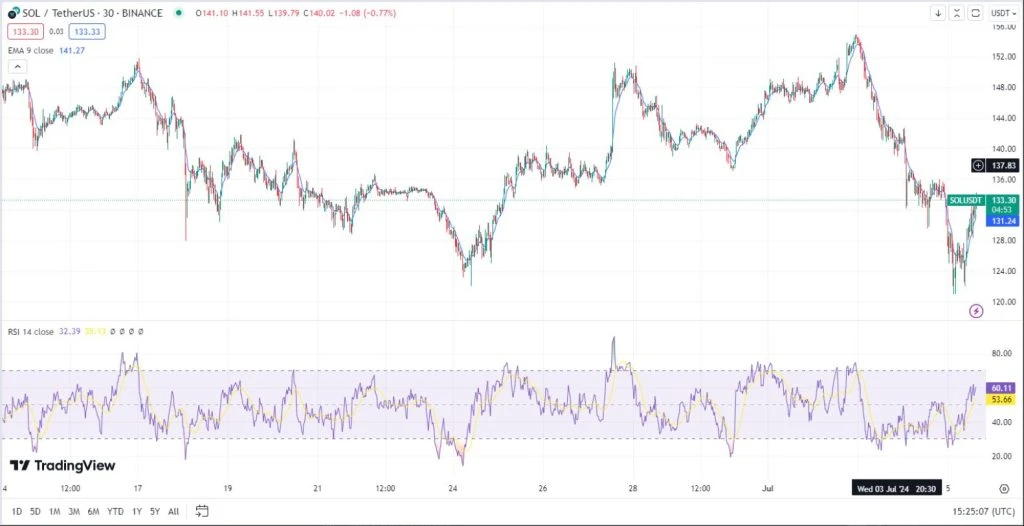
Recent trading patterns for Solana depict a series of highs and lows, with the price on an upward trajectory after a significant decline. This recovery is characterized by a rise from the low around $131.24, testing the strength of existing support levels. The price has risen to around $133.30, marking a promising trend, but still requires a decisive advance above the EMA to firmly establish a reversal from the prevailing downtrend.
Key areas of support and resistance
Key support for the asset in question is currently identified around $131.24. This level has proven to be a significant level, as evidenced during a recent price decline where a pullback occurred, suggesting that this area is where buyers typically intervene, creating upward pressure. A breach below this level could lead to further price declines, marking it as a crucial point for traders to watch.
If primary support is compromised, secondary support near $128.00 becomes important. This level, marked by previous instances where the price found stability after declines, can serve as an additional protection against downward trends, providing a possible moment for price recovery.
On the resistance front, the immediate hurdle is around $141.27, aligned with the 9-day exponential moving average (EMA). This EMA currently has dynamic resistance, with price often trying to hold breaks above this threshold, indicating continued selling pressure. Breaking this barrier could signal a shift to an uptrend, suggesting that the market may be about to gain bullish momentum.
Further, strong resistance is forecast around $144.00. If the asset breaks above the EMA, this subsequent level has historically acted as an important ceiling, with high prices often followed by pullbacks. A breakthrough here could signal an escalation in buyer dominance, potentially paving the way for an extended uptrend.
Image Source : coinfomania.com